Recent postings by Erica Hagen and Gwilym Eades about the colonialism of mapping places remotely have led to some discussion about OpenStreetMap going local only – eschewing remote mapping in all but very rare cases. I find this view of this incredible global project to be in error, furthermore I am creating tools that will make it even easier to find remote places to map – hopefully increasing the number of remote mappers and the amount of remote mapping work done.
Colonialism
I find the premise of these articles to be incredibly narrow, focusing on the emergency response aspect of the map and also somehow managing to make a polygon that represents a building into an imperial construct of oppression.
Now for those who belong to nations that were or are empires it is probably ingrained to be wary of becoming too imperial. For those of us that belong to former colonies no such mental barrier exists, we have been where many nations are currently, they are mere decades behind us in infrastructure and not centuries, as they are in comparison to the empires of past and present. We know the hunger that drives us to get better as quickly as possible, to build infrastructure that aids in the development of our nations and we had no or few adversaries then that tried to hold us back for cultural reasons, fearing we were overextending ourselves and losing ourselves in the process.
To be able to assist others to go further faster, that is something we would have liked to have (and did indeed sometimes receive such help) and so we are puzzled to be accused of imperial land grabs for our efforts.
The articles in question focus on the humanitarian mapping that has been in the news and manages somehow to present what was a boon to people in the field, both locals and those that arrived to lend aid, as an affront to locals and their culture.
The HOSM efforts and missing maps will end up, instead, homogenising that same map forever, westernising it, colonising it, and in effect coopting the last vestiges of autonomy in its creation that remain(ed).
Gwilym Eades
How do you manage to colonise a country by displaying its basic infrastructure on a map, a map that makes it easier for locals to get involved and add better local data? How can a building in Botswana be westernized when it is a polygon with the same values as a building in any other continent, if a local adds the detail of its material as mud or straw does it then become Africanized and no longer a colonial subject?
This premise of the articles is indeed the most imperialistic aspect. The self-expression mentioned sounds like any local is a noble savage, and the remote mappers are the decadent civilization encroaching on their territory.
The blank slate
One argument put forward is that by not presenting locals with a blank slate of their home we rob them of their self expression. That is a ridiculous notion as the map can be edited by anyone at a later date, it is also a total opposite of how most people interact with the digital world.
Through my work on OpenStreetMap I have been in contact with locals in many places, both in my native land and abroad. Presenting them with a blank map of their home and telling them they can map it now, using their “own expression”, has not given much result, the percentage of people that see a blank slate that then find the appropriate tool and read up on documentation and experiment is low, evidenced by the low number of original OSM mappers.
The best results in getting locals to contribute has been to map their area remotely and then get them to contribute data, it is easy for most people to see their village on a map and point to where the tavern, healthcare and shop are, they are not creating anything from scratch but adding details to a slate that makes it easier for them to lend their knowledge. By mapping remotely the map is given a leg up.
Some examples are Khawa in Botswana and Eilao in Spain, in both cases I was in contact with a local, showed them that it would be easy to map, got interest but no effort from them due to a technical barrier, mapped the place remotely and showed them again – then receiving feedback that allowed me to add details to the map.
Remote mapping works
The success stories from Liberia and Nepal and past global responses have been many, less known are the umpteen successes that occur every day with the aid of remote mappers on OpenStreetMap in conjunction with local people, foreign and native.
The Peace Corps have thousands of volunteers all over the world and they use OpenStreetMap and remote working to aid in their work as they aid in healthcare for example. An example is the Stomp Out Malaria program, one report detailed how a village in Botswana’s Chobe District was visited by volunteers who checked which houses had been sprayed by using a GPS device and handheld records, then using a base map from OSM to see which places had not yet been sprayed and then with this knowledge they managed to make a plan to revisit places to spray, thereby going from 61,4% coverage to obtaining the 80% threshold that is the minimum recommended coverage.
The base map had been created by remote mappers just days before the visit of the volunteers. This added procedure of mapping was found to be cost-effective and more vitally, enhance the odds of success in combating malaria, a disease that kills hundreds of thousands of people every year, mostly in sub-Saharan Africa and overwhelmingly young children. Just now task #1057 is finishing, Mapping Mosetse, with several benefits for the locals in aiding the locals.
The spirit of OpenStreetMap
More poetically perhaps, I also see maps as representations of who made them rather than a place per se.
Erica Hagen
I’m curious as to how remote mapping interferes in the expression of locals. For a map to be global some minimum standardization is required, we use a polygon in the outline of the building to mark it on the map, or a point. We put addresses as attributes of the polygons or as a seperate point inside, or without, a polygon. We do not generally mark addresses as a line between two points although that is possible.
The spirit of OpenStreetMap is not in my mind to stay in your own garden, to mind your own business and not aid in other areas. No project I have participated in has had that expectation of its volunteers, amongst them are Distributed Proofreaders, Project Gutenberg and various Wikimedia projects in a variety of languages.
The spirit of OpenStreetMap is to make a map of the world, including those places that are not commercially viable for other providers and whose population lacks the technology and monetary power to do it themselves. No village left behind.
The mobile world
The number of people that are reaching middle class status in the developing world has been growing and will grow further still, in tens of millions in the coming years. Most of these go mobile and mobile is where editing OpenStreetMap is very much lacking still – not to mention that data charges are still very expensive and lacking in distribution in the developing world, even the developed world.
Try drawing the outlines of buildings on a mobile editor, it will take you an order of magnitude longer to map a village on it rather than using a more powerful desktop editor. Adding smaller items is easier and less of a pain on mobile editors, being able to add points of interest is much more feasible. Totally eschewing remote mapping and telling locals they need to get by on their current hardware using their current connectivity is another example of imperialism in action – leaving the noble savages to fend for themselves.
Remote mapping made easier
I myself did what most others do when they discover OpenStreetMap, I first looked at my local area and improved it. Currently it is pretty much in maintenance mode only, adding or moving POI and on the lookout for buildings being built or torn down. Suddenly my hobby needed more outlets and so I expanded, and expanded more and now I’ve touched the map in dozens of countries.
That was all very random though, zooming in randomly onto the map to find something that was missing, blank slates often and adding something to them.
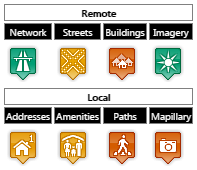
So I’m building a tool, Askja, that makes it easier to improve data where it is lacking. I split it up into two areas, remote and local. Remote mapping is traditional, roads and buildings – the base map. Local mapping is needed for addresses and street names, amenities, paths and Mapillary images.
For each country I add into the tool Overpass is used to get a list of all cities, towns, villages and hamlets. Those are then assigned to regions and subregions using Nominatim. Finally the quality of the current data is evaluated using Overpass and Mapillary APIs, the bot that runs the evaluation checks for roads, buildings, amenities, paths and Mapillary images and marks a scorecard for each settlement.
The scorecard has 4 different values generally, grey for unknown, red for absence, yellow for partial coverage and green for good coverage. The bot can upgrade network to green status and the others to yellow status automatically. To upgrade anything to green a human is needed to look the area over and pass its judgement. Imagery needs to be evaluated by humans at this point, perhaps that can be automated as well.
Some examples:
- A well mapped area, very green: Höfuðborgarsvæðið, Iceland
- Area that needs better imagery: Akureyrarkaupstaður, Iceland
- Good imagery, needs mappers: South-East District, Botswana
- Good imagery, needs mappers: Buthe-Buthe District, Lesotho
- Good imagery, Tiger data, needs buildings: Benton County, Arkansas, USA
- No imagery , good address imports: Sandoyar sýsla, Faroe Islands
So how does it help us to have a list of places that are lacking data – or have data? It makes it easier for the community to find weak spots in their area of interest, whether it is nearby them or not.
The tool is in alpha status – many more features will be added to make it easier for new mappers to find suitable tasks and for niche mappers to find tasks that interest them. We have niche mappers that only like to do the road network, others prefer to map the streets of a village and yet others just want to add buildings or forests or trees.
In addition this approach makes it easier to find quality assurance problems, triplicate settlement nodes (imports gone wrong), settlements that lack names, similarly named settlements within a few hundred meters from each other and more. Not to mention places that are marked as villages but are a tourist campsite, a tavern or otherwise.
Good housekeeping is a part of making a map. Approaching the task of making a world map from many different angles makes the map stronger, it makes the map better.
Everyone needs a map
Today the Western world is used to maps being easy to come by in digital formats, they listen to their smart devices as they use location services from OSM, HERE, Google, TomTom and other providers. They are the base that companies like Uber and FedEx depend on.
The growth potential for communities who are lacking these maps is phenomenal, to withhold that power from huge areas of the world is colonialism, aiding them isn’t.
In addition the locals are not the only people who will need to use a map. Tourists, passers-by, people moving their goods or offering their services also need maps of places where they go. Everyone needs a map even if not everyone wants to make it or use it.